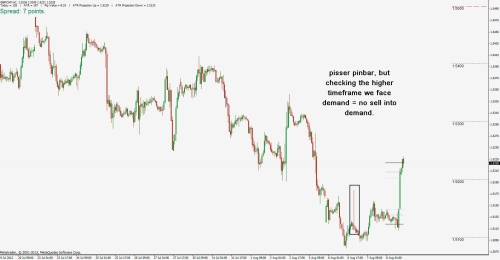
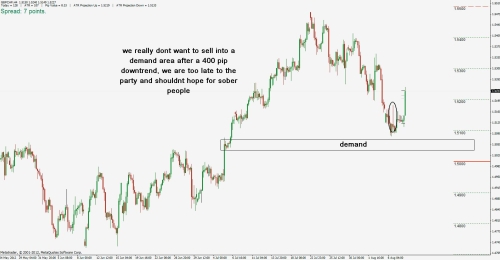
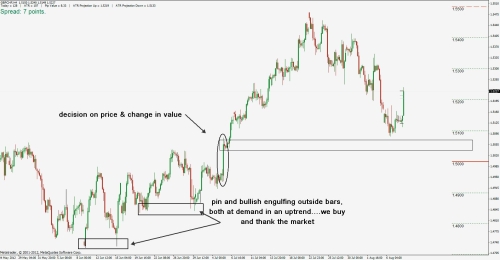
This article is written with the intent to explain basic supply and demand economics and how retail forex traders could benefit from this knowledge. Most retail forex traders are not finance geek and have limited knowledge about market dynamics and how forex market operates.
Early Trading Years
I entered the world of forex trading about four years ago and I came from a Management background. When I started trading, I did not have any clue whatsoever about forex market. I used to visit different trading forums and financial news websites in search of a profitable system, where I saw different explanation of price movements. Some financial news website would say that the reason US Dollar fell against Euro because it reached a 50% fibonacci retracement, whereas another forum would state that the price fell because it hit 100 day moving average, other financial experts would argue that prices fell cause it touched a descending trend line and a bunch of experts would say that price fell cause it reached a resistance level.
As a novice trader, I used to scratch my head because all these different explanations were too much for me to grasp and it was hard to keep up with it. As a result, I used to fill my charts with tons of indicators, where it was sometimes hard to even see price candles. I knew that there has to be some logical explanation for all these price movements. So I decided to dig deep and do some research and find the one idea that above all is what drives the market and is displayed on our charts. It did not took me long to realize that all these price movements, I see on currency charts are result of supply and demand imbalance. If price is moving up it means there are more willing buyers for that currency at that point in time and if it is moving down it means there are more willing sellers for that particular currency. Price is simply moving from one zone to another zone to fill these orders.
The information I am presenting in this article about Supply & Demand is learned and attained from numerous sources and I will try my level best to explain it in the simplest of form. Some folks might disagree with my point of view, but I always believe that two people might see similar thing and have completely different point of view. So let's get started:
Definition
Q. What is the definition of Supply ?
A. Supply is the quantity of an item available for buyers at a certain price.
Q. What is the definition of demand ?
A. Demand is the quantity of an item which is wanted by buyers at a certain price.
Q. What is imbalance of Supply & Demand?
A. (I) If the available Supply of an item exceeds the demand for it then prices tend to fall.
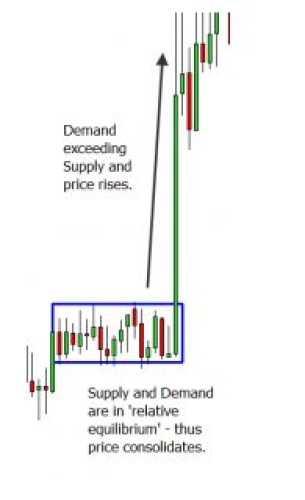
(II) If demand for a certain item exceeds the available supply then prices tend to rise.
Q. What is Price equilibrium ?
A. The market price at which the supply of an item equals the quantity demanded.
From above definitions, we now understand what is supply, demand, imbalance of supply & demand and price equilibrium. Now let's go into further details with some examples.

Example - Supply Exceeds Demand
From the above explanation, we now know that supply and demand are fundamental driver of price. Now lets look it into simple context to better understand how supply exceeds demand. Let's assume its winter season and a customer goes to an electronics retail store to buy something. As he enters a store he sees a sign board offering 50% discount on air conditioners, but he hardly see anybody interested in buying it, despite the low price. What could be the reason for it. The simple and logical reason is since its winter, and the weather is cold, this item is not wanted by buyers cause it's of no use to them right now, however since the store is aware that there is lack of demand for this item, they are offering discounted price to entice buyers. This is classic example of supply exceeding demand viz. there is less demand for air conditioner in winter season, but more supply available, as such item was offered at a discounted price.
Example - Demand Exceeds Supply
Now lets look at similar scenario to understand how demand exceeds supply. It's winter season and a customer goes to an electronic retail store to buy a Heater, but it was out of stock, so he goes to another store hoping he would get it there, but unfortunately they are also out of stock. Thereafter, he goes to third store and finally he sees heaters available, at that store, but the problem is there are lot of customers already standing in line to buy it. Moreover, there is no discount offered on heater, in fact the price is much higher than normal, but lot of customers are still buying it. This is classic example of demand exceeding supply viz. there is more demand for heater being a winter season, but available supply is limited. Since many stores are out of stock, this particular store which have heaters raised the price due to excessive demand.
 Example - Price Equilibrium
Now here is another scenario to understand Price equilibrium. It's winter season and a customer went to an electronic retail store to buy a Heater, there he sees enough heaters available at the store and some people are buying it. The store is not offering any discount nor the price is higher than normal. Since there was enough quantity available for this item and limited number of customers are buying it, the customer decides to check another store to see, if he can get a better price. He knows that this item will not be out of stock for the time being, so he visits another store and notice the same scenario as store one. This is classic example of price equilibrium viz. a supply of heater by retail store & demand by customers are equal, as such price is not at discount nor it is higher than normal.
How to identify Supply & Demand Levels on Forex Chart
Now that we have better understanding of price equilibrium and imbalance of Supply & Demand. We will go a step further and see how we can benefit from this knowledge in forex market.
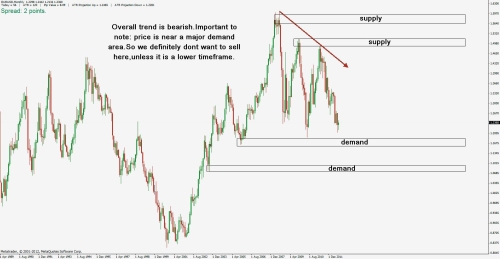
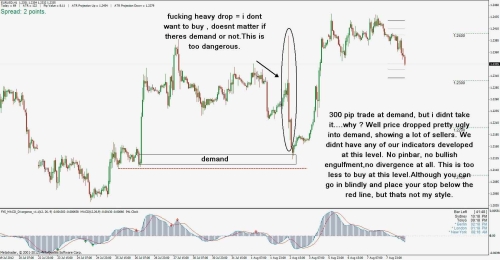
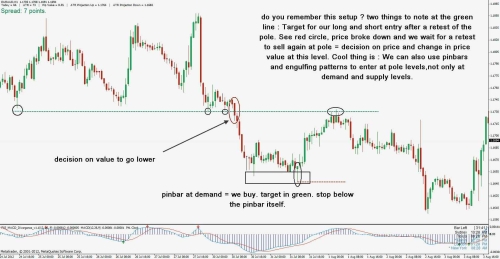
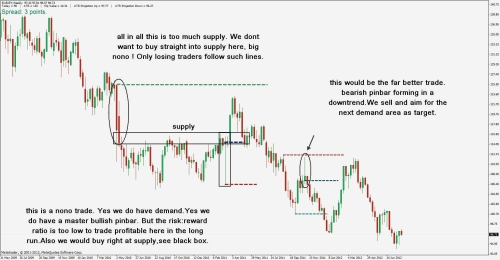
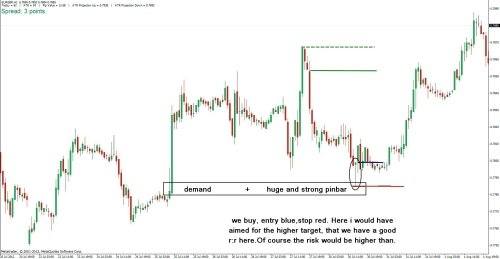
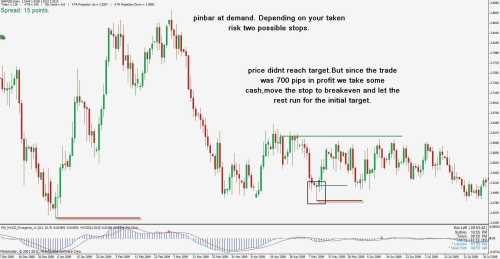
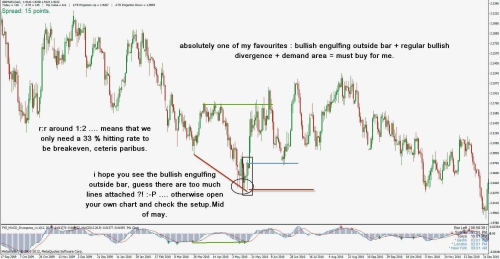
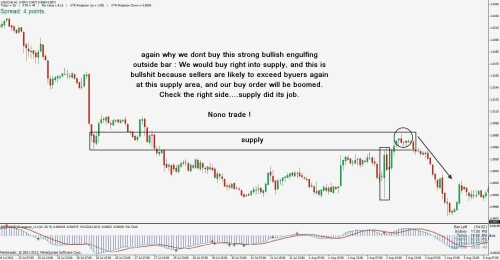
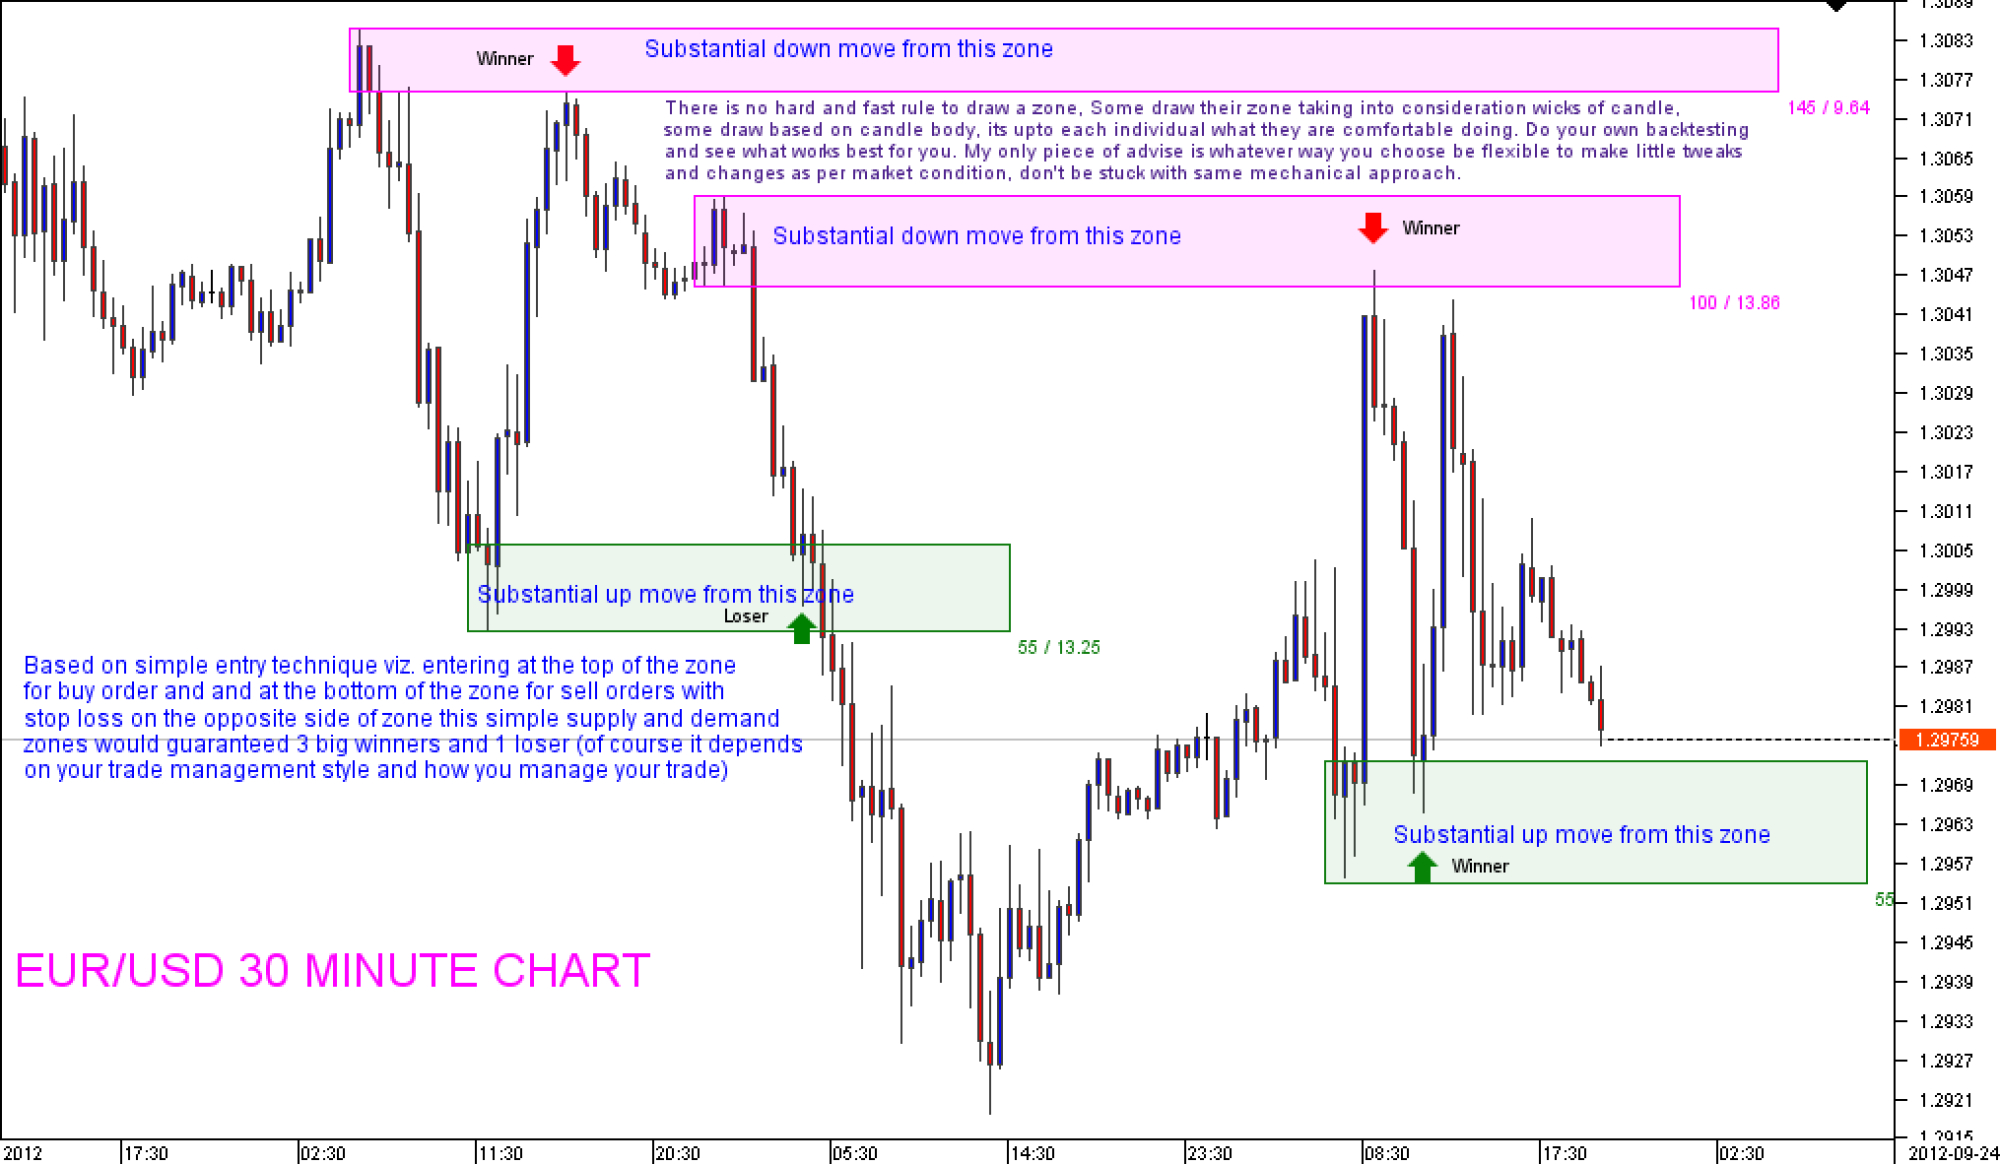
As in any market the purpose of trader / speculator / investor is to buy an item or instrument at discount (wholesale price) and sell at retail price, the forex market is no different. We as retail traders are unable to see actual buy/sell orders in forex market, but we can apply our knowledge of supply & demand to identify our next level of interest, where we believe smart money (large players / institutional traders, real market movers) are most likely to place their orders. Our main area of interest would be, where price made a substantial move from a particular zone and where actual imbalance of supply and demand between buyers and sellers occurred. It could be a series of candles or one candle, but it should clearly show a decision point where either buyers or sellers took charge. Once a zone is identified, our job is to wait until price approaches that zone again. We could either place a limit order or watch price action to enter trade at that zone.
As with any system or strategy we cannot be 100% sure that price will again respect that zone, but there is a higher probability than not that price would react at that zone, considering the way price left that level the first time, suggest that buyers/sellers consider it as an important zone. Let's look at attached chart example, which is self explanatory:
Price Structure
There are four common structures that are used to identify supply & demand levels on forex charts:
1) Drop- Base- Rally
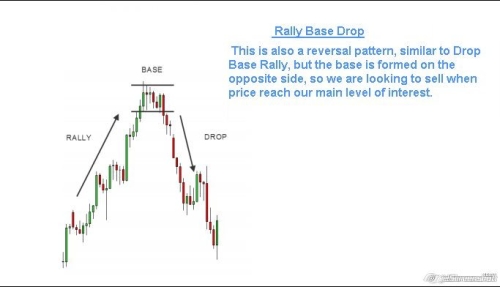
2) Rally-Base-Drop
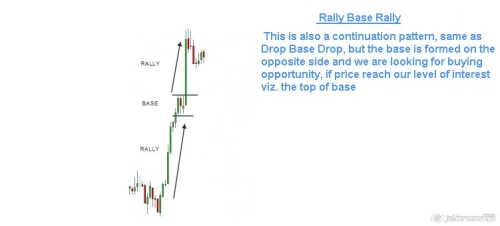
3) Rally-Base-Rally
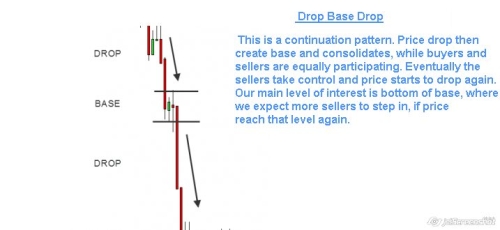
4) Drop-Base-Drop
____________________________________________________________________________

_____________________________________________________________________________
_____________________________________________________________________________
I firmly believe that once a trader understands supply & demand dynamics and trade with patience, discipline and proper risk management, he/she could achieve success in trading.
Here are some of my favorite Quotes from successful traders:
Early Trading Years
I entered the world of forex trading about four years ago and I came from a Management background. When I started trading, I did not have any clue whatsoever about forex market. I used to visit different trading forums and financial news websites in search of a profitable system, where I saw different explanation of price movements. Some financial news website would say that the reason US Dollar fell against Euro because it reached a 50% fibonacci retracement, whereas another forum would state that the price fell because it hit 100 day moving average, other financial experts would argue that prices fell cause it touched a descending trend line and a bunch of experts would say that price fell cause it reached a resistance level.
As a novice trader, I used to scratch my head because all these different explanations were too much for me to grasp and it was hard to keep up with it. As a result, I used to fill my charts with tons of indicators, where it was sometimes hard to even see price candles. I knew that there has to be some logical explanation for all these price movements. So I decided to dig deep and do some research and find the one idea that above all is what drives the market and is displayed on our charts. It did not took me long to realize that all these price movements, I see on currency charts are result of supply and demand imbalance. If price is moving up it means there are more willing buyers for that currency at that point in time and if it is moving down it means there are more willing sellers for that particular currency. Price is simply moving from one zone to another zone to fill these orders.
The information I am presenting in this article about Supply & Demand is learned and attained from numerous sources and I will try my level best to explain it in the simplest of form. Some folks might disagree with my point of view, but I always believe that two people might see similar thing and have completely different point of view. So let's get started:
Definition
Q. What is the definition of Supply ?
A. Supply is the quantity of an item available for buyers at a certain price.
Q. What is the definition of demand ?
A. Demand is the quantity of an item which is wanted by buyers at a certain price.
Q. What is imbalance of Supply & Demand?
A. (I) If the available Supply of an item exceeds the demand for it then prices tend to fall.
(II) If demand for a certain item exceeds the available supply then prices tend to rise.
Q. What is Price equilibrium ?
A. The market price at which the supply of an item equals the quantity demanded.
From above definitions, we now understand what is supply, demand, imbalance of supply & demand and price equilibrium. Now let's go into further details with some examples.

Example - Supply Exceeds Demand
From the above explanation, we now know that supply and demand are fundamental driver of price. Now lets look it into simple context to better understand how supply exceeds demand. Let's assume its winter season and a customer goes to an electronics retail store to buy something. As he enters a store he sees a sign board offering 50% discount on air conditioners, but he hardly see anybody interested in buying it, despite the low price. What could be the reason for it. The simple and logical reason is since its winter, and the weather is cold, this item is not wanted by buyers cause it's of no use to them right now, however since the store is aware that there is lack of demand for this item, they are offering discounted price to entice buyers. This is classic example of supply exceeding demand viz. there is less demand for air conditioner in winter season, but more supply available, as such item was offered at a discounted price.

Example - Demand Exceeds Supply
Now lets look at similar scenario to understand how demand exceeds supply. It's winter season and a customer goes to an electronic retail store to buy a Heater, but it was out of stock, so he goes to another store hoping he would get it there, but unfortunately they are also out of stock. Thereafter, he goes to third store and finally he sees heaters available, at that store, but the problem is there are lot of customers already standing in line to buy it. Moreover, there is no discount offered on heater, in fact the price is much higher than normal, but lot of customers are still buying it. This is classic example of demand exceeding supply viz. there is more demand for heater being a winter season, but available supply is limited. Since many stores are out of stock, this particular store which have heaters raised the price due to excessive demand.
 Example - Price Equilibrium
 Now here is another scenario to understand Price equilibrium. It's winter season and a customer went to an electronic retail store to buy a Heater, there he sees enough heaters available at the store and some people are buying it. The store is not offering any discount nor the price is higher than normal. Since there was enough quantity available for this item and limited number of customers are buying it, the customer decides to check another store to see, if he can get a better price. He knows that this item will not be out of stock for the time being, so he visits another store and notice the same scenario as store one. This is classic example of price equilibrium viz. a supply of heater by retail store & demand by customers are equal, as such price is not at discount nor it is higher than normal.
How to identify Supply & Demand Levels on Forex Chart
Now that we have better understanding of price equilibrium and imbalance of Supply & Demand. We will go a step further and see how we can benefit from this knowledge in forex market.
As in any market the purpose of trader / speculator / investor is to buy an item or instrument at discount (wholesale price) and sell at retail price, the forex market is no different. We as retail traders are unable to see actual buy/sell orders in forex market, but we can apply our knowledge of supply & demand to identify our next level of interest, where we believe smart money (large players / institutional traders, real market movers) are most likely to place their orders. Our main area of interest would be, where price made a substantial move from a particular zone and where actual imbalance of supply and demand between buyers and sellers occurred. It could be a series of candles or one candle, but it should clearly show a decision point where either buyers or sellers took charge. Once a zone is identified, our job is to wait until price approaches that zone again. We could either place a limit order or watch price action to enter trade at that zone.
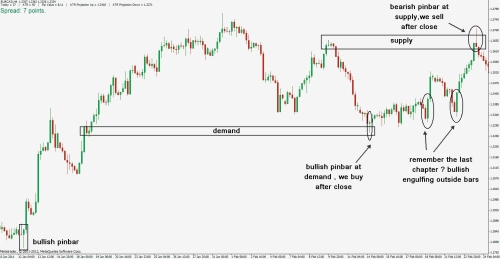
As with any system or strategy we cannot be 100% sure that price will again respect that zone, but there is a higher probability than not that price would react at that zone, considering the way price left that level the first time, suggest that buyers/sellers consider it as an important zone. Let's look at attached chart example, which is self explanatory:

Price Structure
There are four common structures that are used to identify supply & demand levels on forex charts:
1) Drop- Base- Rally
2) Rally-Base-Drop
3) Rally-Base-Rally
4) Drop-Base-Drop
____________________________________________________________________________


_____________________________________________________________________________

_____________________________________________________________________________
I firmly believe that once a trader understands supply & demand dynamics and trade with patience, discipline and proper risk management, he/she could achieve success in trading.
Here are some of my favorite Quotes from successful traders:
- Don't think about what the market's going to do, you have absolutely no control over that. Think about what you're going to do if it gets there.
- All we can do at best is look for historical reasons and apply this to a level or price area for possible future moves. Trading is neither science or art, it is a reflection of what value humans place on a particular financial instrument at a given point in time.
- If you must play, decide upon three things at the start: the rules of the game, the stakes, and quitting time
