Thursday, September 6, 2012

Bull Trap – Chart Reversal Pattern


Bull Trap Definition

A bull trap occurs when longs take on a position when a stock is breaking out, only to have the stock reverse and shoot lower. This counter move produces a trap and often leads to sharp sell offs.

Bull Trap Setup

Bull traps have a very basic setup. You will want a recent range to be broken to the upside with preferably high volume. The stock will need to get back below resistance within 5 candlestick bars, then explode out of the bottom of the range. The last component of the bull trap chart pattern is that the stock should have a decent price range. A wide price range is critical, as it increases the odds that the stock will have room to trend in order to book quick profits.

Why do Bull Traps produce sharp sell offs?

The first wave of selling will occur when the most recent swing low is exceeded, due to the number of shorter term traders who have their stops slightly below the most recent swing low. The second wave of selling comes into play once the strong longs realize that this is not just a slight retracement, but that the move has legs. This will produce the second round of selling, which will often precede the short-term low in the counter move.

Bull Trap Charting Example

Below is an example of a bull trap that takes place in Honeywell (HON) over two days from 9/6 – 9/7. HON broke out on the close of 9/6, only to gap down and break the low of the preceding range on 9/7. This sharp counter move created the perfect bull trap, hence the sell off you see below became a reality.
Bull Trap

Bull and Bear Trap


Bull Traps

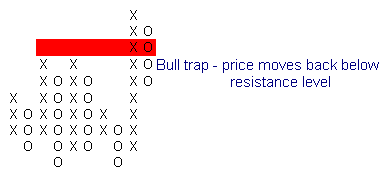
Bull traps occur when an upward breakout retreats back below a resistance level. Resistance is normally associated with two/more equal highs or an earlier major high.
  • Bull traps should be traded in a down-trend.
  • They may also signal reversal after an extended up-trend.
Go short when price falls back below the resistance level.

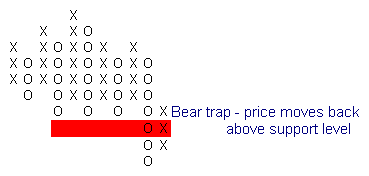
Bear traps occur when a downward breakout retreats back above a support level. Support is normally associated with two/more equal lows or an earlier major low.
  • Bear traps should be traded in an up-trend.
  • They may also signal reversal after an extended down-trend.
Go long when price rises above the support level.

Wide Bull and Bear Traps

Bull and bear traps (and false breaks) often occur in longer time frames as well.
Ford Motor Co. displays a bull trap that took more than a year to complete:
  1. Price spiked up to a new high, in early 1998, but quickly retraces.
  2. Resistance forms just below the previous high. The strong following correction is a bearish sign.
  3. Bull trap: Price rallies to a marginal new high but then retreats below the new support level.
  4. A short retracement confirms the trend change.
  5. An equal lower high confirms resistance has formed at 32.00: the low before [3]. A strong bear signal.
  6. Another attempted rally peters out.
  7. Equal highs in a down-trend are a strong bear signal; and are followed by a long downward spike.

Digging Deeper Into Bull And Bear Markets


November 06 2009| Filed Under » , , , 


Almost every day in the investing world, you will hear the terms "bull" and "bear" to describe market conditions. As common as these terms are, however, defining and understanding what they mean is not so easy. Because the direction of the market is a major force affecting your portfolio, it's important you know exactly what the termsbull and bear market actually signify, how they are characterized and how each affects you.

What Are Bear and Bull Markets?
Used to describe how stock markets are doing in general - that is, whether they are appreciating or depreciating in value - these two terms are constantly buzzing around the investing world. At the same time, because the market is determined by investors' attitudes, these terms also denote how investors feel about the market and the ensuing trend.

Simply put, a bull market refers to a market that is on the rise. It is typified by a sustained increase in market share prices. In such times, investors have faith that the uptrend will continue in the long term. Typically, the country's economy is strong and employment levels are high.
On the other hand, a bear market is one that is in decline. Share prices are continuously dropping, resulting in a downward trend that investors believe will continue in the long run, which, in turn, perpetuates the spiral. During a bear market, the economy will typically slow down and unemployment will rise as companies begin laying off workers. (For related reading, see Adapt To A Bear Market.)

Where Did the Terms Come From?
The origins of the terms "bull" and "bear" are unclear, but here are two of the most common explanations:
  1. The bear and bull markets are named after the way in which each animal attacks its victims. It is characteristic of the bull to drive its horns up into the air, while a bear, on the other hand, like the market that bears its name, will swipe its paws downward upon its unfortunate prey. Furthermore, bears and bulls were literally once fierce opponents when it was popular to put bulls and bears into the arena for a fight match. Matches using bulls and bears (whether together or gains other animals) took place in the Elizabethan era in London and were also a popular spectator sport in ancient Rome.
  2. Historically, the middlemen who were involved in the sale of bearskins would sell skins that they had not yet received and, as such, these middlemen were the first short sellers. After promising their customers to deliver the paid-for bearskins, these middlemen would hope that the near-future purchase price of the skins from the trappers would decrease from the current market price. If the decrease occurred, the middlemen would make a personal profit from the spread between the price for which they had sold the skins and the price at which they later bought the skins from the trappers. These middlemen became known as bears, short for "bearskin jobbers", and the term stuck for describing a person who expects or hopes for a decrease in the market.
Characteristics of a Bull and Bear Market
Although we know that a bull or bear market condition is marked by the direction of stock prices, there are some accompanying characteristics of the bull and bear markets that investors should be aware of. The following list describes some of the factors that generally are affected by the current market type, but do keep in mind that these are not steadfast or absolute rules for typifying either bull or bear markets:
  • Supply and Demand for Securities - In a bull market, we see strong demand and weak supply for securities. In other words, many investors are wishing to buy securities while few are willing to sell. As a result, share prices will rise as investors compete to obtain available equity. In a bear market, the opposite is true as more people are looking to sell than buy. The demand is significantly lower than supply and, as a result, share prices drop. (For more on this, read Economics Basics: Demad and Supply.)
  • Investor Psychology - Because the market's behavior is impacted and determined by how individuals perceive that behavior, investor psychology and sentiment are fundamental to whether the market will rise or fall. Stock market performance and investor psychology are mutually dependent. In a bull market, most everyone is interested in the market, willingly participating in the hope of obtaining a profit. During a bear market, on the other hand, market sentiment is negative as investors are beginning to move their money out of equities and into fixed-income securities until there is a positive move. In sum, the decline in stock market prices shakes investor confidence, which causes investors to keep their money out of the market - which, in turn, causes the decline in the stock market. (For related reading, see Taking A Chance On Behavioral Finance.)
  • Change in Economic Activity - Because the businesses whose stocks are trading on the exchanges are the participants of the greater economy, the stock market and the economy are strongly connected. A bear market is associated with a weak economy as most businesses are unable to record huge profits because consumers are not spending nearly enough. This decline in profits, of course, directly affects the way the market values stocks. In a bull market, the reverse occurs as people have more money to spend and are willing to spend it, which, in turn, drives and strengthens the economy.

How to Gauge Market Changes
The key determinant of whether the market is bull or bear is the long-term trend, not just the market's knee-jerk reaction to a particular event. Small movements only represent a short-term trend or a market correction. Of course, the length of the time period that you are viewing will determine whether you see a bull or bear market.

For instance, the last two weeks could have shown the market to be bullish while the last two years may have displayed a bearish tendency. Thus, most agree that a decided reversal in the market should be ascertained by the degree of the change: if multiple indexes have changed by at least 15-20%, investors can be quite certain the market has taken a different direction. If the new trend does continue, it is because investors are perceiving a changes in both market and economic conditions and are thus making decisions accordingly.

Not all long movements in the market can be characterized as bull or bear. Sometimes a market may go through a period of stagnation as it tries to find direction. In this case, a series of up and downward movements would actually cancel-out gains and losses resulting in a flat market trend.

What To Do?
In a bull market, the ideal thing for an investor to do is take advantage of rising prices by buying early in the trend and then selling them when they have reached their peak. (Of course, determining exactly when the bottom and the peak will occur is impossible.) On the whole, when investors have a tendency to believe that the market will rise (thus being bullish), they are more likely to make profits in a bull market. As prices are on the rise, any losses should be minor and temporary. During the bull market, an investor can actively and confidently invest in more equity with a higher probability of making a return.

In a bear market, however, the chance of losses is greater because prices are continually losing value and the end is not often in sight. Even if you do decide to invest with the hope of an upturn, you are likely to take a loss before any turnaround occurs. Thus, most of the profitability will be found in short selling or safer investments such as fixed-income securities. An investor may also turn to defensive stocks, whose performances are only minimally affected by changing trends in the market and are therefore stable in both economic gloom and boom. These are industries such as utilities, which are often owned by the government and are necessities that people buy regardless of the economic condition. (For related reading, see Bear-Proof Your Retirement Portfolio.)
Conclusion
There is no sure way to predict market trends, so investors should invest their money based on the quality of the investments. At the same time, however, you should have an understanding of long-term market trends from a historical perspective. Because both bear and bull markets will have a large influence over your investments, do take the time to determine what the market is doing when you are making an investment decision. Remember though, in the long term, the market has posted a positive return.

Read more: http://www.investopedia.com/articles/basics/03/100303.asp#ixzz25hCtM2d9

Wednesday, September 5, 2012

Double Top/Bottom


Doble Top/Bottom pattern occurs when we’re facing a new trend or a correction coming. It often forms before breaking trendlines or any other important levels. Finding two Highs or two Lows at the same level very often means that the buying/selling potential is running out and a new side of the market is getting stronger. See some examples below.

Highs & Lows – trend recognition


Highs & Lows issue is in the first place of our list but not without reason. It’s actually not a pattern but  characteristic points on the graph, which proper interpretation will allow you to gain mystery of the problem, which only superficially seems trivial – recognition of the trend.

As you probably know, there are three possible scenarios of currency price movement: uptrend (1), horizontal trend (2) or downtrend (3). Each is presented below:
But what exactly determines which trend are we facing? Look again for the same figure but this time with the highs and lows marked on the price chart.
As you probably noticed in each trend, highs (blue dots) and lows (red dots) are arranged in a characteristic manner for each of the trends. In an uptrend, they appear higher and higher, in horizontal trend they move towards a common point (they can move away from each other or create one or two perpendicular lines as well), and in a  downtrend each high and low appears lower than previous. It looks simple, but when you add a problem of time interval, in which you examine the trend, things can get messy.  That is beacause every major trend consists of a specified number of smaller trends, what you can clearly see on the graph below:
The main problem of recognizing the market sentiment is the time interval, in which we examine the trend. We can see a strong uptrend on a H1 chart, but when we switch to D1 or even H4, the situation may change entirly and it will turn out that our strong H1 uptrend was only a small pullback of a much bigger move. How to handle this problem? Try to open position when you see that trends on different time intervals have the same direction. It may sound simple but in practice you will find out that by the time you realize that trends on H1, H4 and D1 are the same, the lowest timeframe trend had allready exhausted. This is adifficult issue but with some experience it’s possible to find those “magic” turnpoints, wich will allow you to enter the market when trends on a different time intervals are synchronized. I hope that patterns described on this site will help you with that.
© 2012 Forex Price Action  

Quasi Pattern


Quasi Pattern is a pattern which very often occurs when exhaustion of a current trend. It is noticeable practically on every time interval and its main advantages are high repeatability and ease of detection. A typical Quasi Pattern is presented in the following figure:
As you can see, th example above shows an exhaustion of a downtrend ended with a quasi pattern. Look how this pattern exactly looks like:
1. Price makes a local low (or high) (1)
2. Then it retraces and makes a new high (or low) (2)
3. Next, price goes down and stops, making a new lower low (or higher high) (3)
4. Then it goes up again and makes a new higher high (or lower low) (4)
5. Our entry point is the level definied by the local low (high) from the point 1 (5)
In this example price changed its trend after a quasi pattern had occured however it’s not always like that. Quasi pattern can be treated like a consolidation after which the previous trend continues, so be aware that the rebound at point 5 does’t need to bring a huge amount of pips.
Here are some more examples of this pattern (notice that it :

Trendline Rebound


1. Price makes Lower Highs (red dots) which linked together create a trendline.
2. Price breaks through the trendline and makes a Higher High.
3. Price retreats to the trendline and after touching it (blue dot) continues to rise and creates new Highs.
As I mentioned earlier Trendline Rebound is a perfect tool to combine with support and resistance levels. It makes it easier to define potencial entry and stop loss levels, what you can see on some of the examples below.

Canal Exhaustion


As you probably noticed the pattern above is simply an example of a right triangle formation. The resistance level at 1.4543 was tested 3 times until price finally broke through the bottom line of the canal. But be aware that even if this resistance level would got broken but the price wouldn’t reach the upper line of the canal it would still be a Canal Exhaustion pattern signaling that the canal breakout is coming. It can take different forms as long as the basic principle is maintained - after bouncing from the one side of the canal it can’t reach the opposing side. You can clearly see this on the following examples:

Time to be Careful

Posted on  by Jan Arps' Traders' Toolbox
Hawk’s Scan Sentry Report March 26
Well, clearly the American stock indexes are drawing back and everyone wants to know if this is the end of the rally, or is this a buying opportunity? I look at hundreds of charts every weekend and I must say that I am seeing a lot of bearish pivot divergences in the recent highs. Of course, we all know that strongly trending markets are known for giving several false divergence signals before they finally run out of steam. That is what I think we are witnessing here. In the long run (6 months – 1 yr) I am still bullish; I believe that this rally still has more fuel in the form of sidelined money that will eventually push some stocks higher. For the short term, however, I’m tightening my stops and I am being a bit more cautious about the set-ups I’m willing to trade. I am,nonetheless, still looking for good pullback opportunities as well as valid breakouts from congestion.
Here are a few items from this week’s watch list and a little explanation of the technical analysis indicated on the charts. If you want further explanation of any of the indicators on the charts below you can find a ‘legend’ at this link.
_____Longs_____
ESL
(Here we see a breakout of the down trendline and a continuation of the Bull Flag progression after a nice pullback into the Triple Trender.)

UTIW
(A breakout from the down trendline after a pullback into the Triple Trender. Also note the strengthening Radar1 Fear/Greed indicator. )

_____Shorts_____
TOL
(Note the diminishing bullishness in the Radar1 Fear/Greed indicator creating a bearish pivot divergence. I would not short this stock, however, until all three Trenders are bearish and Radar3 Trend Strength crosses below zero. )

AEC
(I like the recent Overbought TE-1 signal and the selling pressure indicated by the Radar1 Fear/Greed indicator.)

May the trend be with you,
Hawk
Jan Arps’ Traders’ Toolbox is not an investment advisory service nor a registered investment advisor or broker-dealer and does not purport to tell or suggest which securities customers should buy or sell for themselves. Examples presented on this site are for educational purposes only.  It should not be assumed that the methods, techniques, or indicators presented in these examples will be profitable or that they will not result in losses. There is a high degree of risk in trading.  Readers using this information are solely responsible for their actions and trade at their own risk. Readers should always check with their licensed financial advisor and their tax advisor to determine the suitability of any investment.

It's Not May Yet!

Posted on  by Jan Arps' Traders' Toolbox

Hawk’s Scan Sentry Report April 2
When I want to look at the American equities markets in general, I look at the E-Mini futures contract as a reference (I also like to day trade it on occasion). This week I noticed a few interesting things from my technical analysis indicators. First, note the consistently decreasing buying pressure over the last few months (indicated by the Radar1 Fear/Greed indicator) as the price has been rising. This is a strong signal that the rally is losing stem. We even saw it dip into the bearish side of the zero line this week for the first time since last November. Could this be a prelude to the old axiom “Sell in May and Walk Away”? Well, it’s not May yet! Note the bullish Pullback 23  signal indicating a likely continuation to the upside, and all three Trenders of the Triple Trender are still bullish.  As noted last week, it is time to be very careful with our swing trades, but I don’t think it’s time to abandon ship yet.  As this rally continues to play itself out I will look for opportunities to sell out of my bullish swing positions (I have not been bearish since late last year). I have already been stopped out of a couple of positions, but I believe that there is still a bit more upside to this rally for short term trades. I am still bullish on my longer term (years) investments as well.
Below are a few individual stocks from this week’s watch list and a little explanation of the technical analysis indicated on the charts. If you want further explanation of any of the indicators on the charts below you can find a ‘legend’ at this link.
_____Longs_____
FDO
(This is a basic breakout of congestion on increasing buying pressure after a nice pullback into the Triple Trender. Radars 1,2 and 3 are all getting stronger .)

FRBK
(Another breakout from congestion, this one accompanied by a TE1 signal and a Pullback 23. Radar1 Fear/Greed shows quite a bit of accumulation in the consolidation period preceding the breakout. )

CYH
(This one just filled a gap which was a key support level and in the process created a bullish pullback divergence in Radar1 Fear/Greed and a bullish Pivot Divergence in Radar2 Price Leader. These are accompanied by a Pullback 23 signal. )


_____Shorts_____
HMSY
(I like the pullback into the Triple Trender and the subsequent Pullback 23 signal. Also note the diminished buying enthusiasm indicated by Radar1 Fear/Greed at the recent highs. )

LNCR
(Radars 1,2 and 3 all just turned bearish as did the Triple Trender. There hasn’t been much buying in the last stages of this rally!)

MTL
(Radar 3 Trend Strength just turned bearish to synchronize with the Triple Trender. Radar1 Fear/Greed is indicating increasing selling pressure on this stock.)

May the trend be with you,
Hawk
Jan Arps’ Traders’ Toolbox is not an investment advisory service nor a registered investment advisor or broker-dealer and does not purport to tell or suggest which securities customers should buy or sell for themselves. Examples presented on this site are for educational purposes only.  It should not be assumed that the methods, techniques, or indicators presented in these examples will be profitable or that they will not result in losses. There is a high degree of risk in trading.  Readers using this information are solely responsible for their actions and trade at their own risk. Readers should always check with their licensed financial advisor and their tax advisor to determine the suitability of any investment.
Posted in Hawk's Picks | Leave a comment