This overview covers a very basic, but powerful reversal trading pattern. There are two versions of the pattern. The primary pattern is called a Gartley. The second pattern is a variation of the Gartley and is called a Butterfly. The Gartley pattern is named after H. M. Gartley who wrote a book in 1935 called “Profits in the Stock Market”. Pages 200-250 of his book display a library of patterns that cover all the patterns in the market ever discussed. You may have heard the phrase “Gartley 222” when referring to this pattern because the pattern is found on page 222 of H. M. Gartley’s book.
The second pattern is called a “Butterfly”, which is a variation of the Gartley. How it was named takes an introduction and brief story about the man who named it. His name is Larry Pesavento. Larry was my introduction to these patterns. I first met him at a commodities seminar I attended in Chicago in 1997. Larry Pesavento began his two hour talk by blurting out “Ninety percent of you in this room are losers”. Needless to say he had captured every person’s attention immediately. He went on saying the national statistics showed that 90% of retail commodity traders lose money. He then said he was going to show us a pattern that he trades and has taught other traders to trade that works on all stocks, all commodities and on all time frames. He pointed to a chart on an overhead that had no price or time, just bars. Then he said “I’ll give anyone $100 who can tell me what this is a chart of”. One trader in the front of the room returned the shock value back to Larry by saying “It’s a 5 minute chart of Intel”. Larry’s eyebrows shot to the top of his head in shock. He smiled, reached into his pocket and peeled a $100 bill from his money clip and handed it to the trader. It didn’t go exactly as Larry had planned, but he didn’t miss a beat and he immediately started teaching how he uses the Gartley pattern with fibonacci ratios to accurately trade reversals. In hindsight, Larry played the odds that nobody in the room would recognize what the chart was of, but he was obviously prepared to take his losses ($100) should the crowd prove him wrong. It was a lesson within a lesson. You play the odds when they are on your side, but you always know your exit strategy.
I bought Larry’s book “Fibonacci Ratios with Pattern Recognition” and within days I began seeing the patterns form everywhere on the charts. I spent several hours a day searching out and trading the patterns. I believe that no trader’s arsenal is complete without a thorough knowledge of how to identify and trade Gartley and Butterfly reversals. They appear on five minute e-mini charts and you can find them on quarterly charts of stocks.
It is easier to learn these patterns by first viewing charts that have already reached their price targets and then reversed. I can tell you by experience that it is not easy to place the trades when you first start trading these patterns because you will place orders at prices that are seemingly nowhere near support or resistence areas. Now that I’ve traded these patterns countless times, it is like riding a bike. I find the pattern, do my analysis and place the trade. I found some interesting volume relationships on my own I’ve never seen addressed anywhere else. That one little volume nugget I discovered has kept my winners at 70%. I teach that volume nugget on the Gartley-Butterfly Training CD-Rom and I use it in my analysis of charts when I provide stock picks for my subscribers at longorshort.com.
Before I dive into the charts I want to say this. What you are about to see and learn is NOT a complete course for learning how to trade Gartley and Butterfly Reversals. My CD-Rom covers the soup to nuts version. This is a basic overview of the patterns looking at some of the fibonacci ratios used within the patterns that help pin point high probability reversal points. The power of these patterns lies in the fact that they work in both bull and bear markets. Equally important is that they work on all time frames. Now lets get started by covering some of the fundamentals before showing how they are applied to actual charts.
We’ll start with the basics and quickly move on to completed examples. The first chart on the left is a Bullish Gartley. It might not look bullish to you, but it should reverse at point D and move higher. The chart on the right is a Bearish Gartley. In this case you would short at point D because a decline from point D is expected.

There are several intricate components to a Gartley, but the most basic rules are: Leg X to A is an impulse move and the retracement leg A to D is a distinct two wave move where leg A to B equals leg C to D (in points).
Here is another key point. The X to A leg in a gartley pattern is ALWAYS greater than the A to D move. In fact one of thecomponents of a good gartley is that you take the distance in points from A to D and divide it by the distance in points from X to A, that result should be a key fibonacci number. My CD-Rom covers the ratios in detail, but you will see some of the ratios in use in some of the examples.
Let’s take a look at a Bearish Gartley that has already completed so we can see the formation on an actual chart. On the right is a daily chart of the S&P 500. The X to A move as you can see, is an impulse down. The two wave move higher from A to D was formed with two equal legs, so that AB=CD. If you look closely you will see in the C to D leg, there is a small two wave move as well. This does not have to occur, but the odds it will reverse at point D seem to be higher when that two wave move is present in the CD leg.

The chart on the left is a Bullish Butterfly. It might not look bullish to you, but it should reverse at point D and move higher. The chart on the right is a Bearish Butterfly. In this case you would short at point D because a decline from point D is expected. Larry named this pattern based on the fact that it looked like the wings of a buttefly. (I drew the thin lines to make that more obvious). The biggest difference between this pattern and the Gartley is that the A to D leg is always GREATER (in points) than the X to A leg. The A to D leg will most often be 1.272 or 1.618 times greater (in points) than the X to A leg.

There are several intricate components to a Butterfly, but the basic rules are: Leg X to A is an impulse move and the retracement leg A to D is a distinct two wave move where leg A to B equals leg C to D (in points).
Unlike the Gartley, the X to A leg of a Butterfly pattern is ALWAYS shorter than the A to D leg. In fact one of the components of a Butterfly is that you calculate the distance in points from X to A and multiply that number by several fibonacci ratios. That number is then used to calculate where the reversal target D should end.
You may notice that ratios of “time” are noted on the chart to the right. That is another component of both Gartley and Butterfly formations that pinpoint turns.

I want to really drive home the point about how these patterns often trade independent to general market. Today is June 6th 2003. On June 2nd I posted a chart on longorshort.com of a Bearish Gartley that was forming on MSFT. It is the chart at the bottom on the left. As you can see on the the top left hand corner of that chart, MSFT made three attempts to close above 26.00 on an hourly basis. If you look closely you can see that each of the three bars that approached 26.00 were rejected and each bar sold off and closed at the low end of that bar. It was clear that sellers were showing up in size on each attempt to clear 26.00. The final attemept was followed by a strong move below 25.50 which had been acting as support before now. Put this level in memory because it becomes important later.
It is crucial to recognize these patterns early before they reach point “D” because many times you will only get one shot at getting filled at the target reversal area. Look on the chart below and focus on wave C to D. You can see that MSFT was trading at 24.97 and I was targeting 25.25 for point D, plus or minus a nickle. Once I see prices in a C to D leg of a Bearish Gartley move above the swing high of point B, I then calculate where point D should target as a reversal level. It is very simple. You add the distance (in points) of leg A to B and add that number to the low of point C, targeted 25.25 for point D. (That is where leg AB would equal CD). If you look at the chart you will recall that 25.50 used to be support. I can tell you from experience, 25.50 would now act as resistence if MSFT tried to rally. A stop just above at 25.55 or 25.60 would be a natural spot to place a buy stop, to cover any shorts taken in the point “D” range. The downside target here is .618 of the C to D leg. If you run the math you’ll see that a winning trade will net you almost twice as much as you would lose if stopped out of the trade. If you trade these patterns often enough and follow my advice using time, price and volume as I teach on the CD-Rom, then you should win on 7 out of 10 trades. A 2:1 win/loss ratio of points won verses points lost would be good even if the strategy was only correct 50% of the time. BUT! you should be able to get that 2:1 per trade ratio with 70% of your trades ending up winners.
The chart on the right is a snapshot of a daily chart of MSFT around noon on 6/6/03. Two days after posting the chart on the left, MSFT rallied up into the reversal zone. The next day it gapped down. The point I want to make is that MSFT is a major component of the Nasdaq 100 and the S&P 500, both of which continued to go on to new highs while MSFT collapsed. One could say that MSFT’s weakness could stall the indicies short term given its size in the market weighted average. But the point I’m making is you have to trade each chart independent of others. Each sector and each stock dances to a different beat.

Let’s look at a chart from the archives. I want to say this is from 1999, but I really don’t remember when it was posted. It is a followup chart showing what happened once prices reached the point D reversal zone. On this chart I actually labeled the smaller ab=cd that appeared in the larger C to D leg. The smaller ab=cd is not a necessary component of a Butterfly reversal, but I have found that it adds to the validity of the pattern. Ask yourself this question… would you have shorted the Nasdaq 100 near 3900 AFTER it had clearly broken above the 3800 resistence? These patterns answered a lot of “whys” I had about breakouts failing. The downside target is .618 of the C to D level or about 278 points off of 3900 around 3622, which was reached in a half a dozen bars once 3900 was hit.

Countless times I have watched for this one pattern alone in stock trading. How many times have you seen a stock poke its head above resistence only to fall back below the breakout point? Some stock traders place buy stops above the market to catch prices that rally above recent highs on strength. This technique works well and I even use that technique trading certain momentum patterns. Just learning this one pattern alone will prevent you from placing buy stops near a point D target of a Bearish Butterfly. Pattern traders who see this formation early are just waiting to use your buy stops as liquidity to get the upticks needed for them to get short the very stock you are trying to buy.
It takes time to learn how to identify and trade both the Gartley and the Butterfly setups. You won’t learn them overnight, but after seeing them form in real time again and again, you will gain confidence in trading them. When I first started, Larry Pesavento was nice enough to take a few phone calls and help coach me while I was a newbie. He faxed me a few charts that he had been watching and it really helped to see them unfold in real time. One of the reasons I opened longorshort.com was to help traders learn how to identify and trade these patterns. In fact one trader even posted his picks on my site.
I used to chat on an active technical analysis message board where traders shared ideas and strategies. I met a trader there who asked a ton of questions and I shared what I had learned about Gartley and Butterfly Reversals and off he went. He did exactly as I did. He started sifting through hundreds of charts and started watching patterns unfold in real time. Like myself, he found this strategy to be robust, and he was so good I invited him into longorshort.com to post his picks because he focused on small to mid-cap stocks.
He posted his charts prior to prices reaching point D just as I did. That way, subscribers could get positioned via limit orders placed days in advance of prices reaching their point D target level. The chart below is a chart he posted after the pattern had completed and after he was stopped out of the remainder of the position.

I share this with you to show you that anyone can become proficient with these patterns if they just put in the time it takes to learn them. I’ve been told by subscribers that one of the reasons they subscribed to longorshort.com was to avoid the time it takes to find the patterns (I did all the hard and dirty work). They also wanted to learn by watching the patterns form in real time. That way, they could see where I place my orders and stops.
There were several things I didn’t teach my subscribers while I ran longorshort.com. I just labeled the chart with buy/sell points and where to place stops on a daily basis. What I didn’t show them was the few critical extra filters and steps I take that no other gartley or butterfly trader uses that I found on my own from trading these patterns over the last six years. I knew that some of my subscribers ran their own web sites and I was keeping the really juicy stuff to myself because I didn’t want to lose subscribers. I don’t run the site anymore so I’ll share with you those extra filters that make all the difference in the world!
I am going to show you how critical it is to follow these patterns as they relate to analyst upgrades and downgrades. The more you trade these patterns the more you will find that you have to ignore wall street. The chart below is just one of many in my archives where a perfectly good reversal pattern was delayed short term by wall street games.
It had all the makings of a great setup for a short at point D near 52. By mid-August it should have rolled over on its own had wall street not decided to pump and dump their inventory into the public’s accounts via their brokers. I feel bad for unsuspecting new stock brokers who don’t understand how the whole “system” is setup and might have actually called a client to recommend MSFT at 53. I have a whole archive of charts like this where wall street distributed reports at key turning points marked by a Gartley or Butterfly Reversal Pattern.
In the case of MSFT below. I didn’t just hold onto shorts… I added to them. There is nothing quite like trading on the same side as the big boys once you understand how the game is played. I can tell you it took me a while to swallow that truth having come from Wall Street and having worked for a firm I assumed had my best interests in mind.

Remember, this is just a brief overview of Gartley and Butterfly Reversal Patterns. What I have just shared with you would cost $25-$50 for a basic book that covers the patterns. You are probably wondering at least two things by now. Where can I get more specifics on how to trade these patterns, and how much will it cost? There are only a handful of sites that cover these patterns in detail. They cost from $50 a month to $300 a month. However, that is just to get online and watch the patterns unfold. If you want specialized training, their going rates are $3000-$6000 for 3-5 days of hands on training.
Source: Longorshort.com

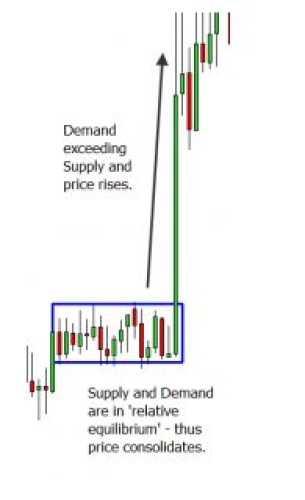
 Example - Price Equilibrium